Aug 31

Last.fm Scrobble Graph

Last.fm profiles show quite a bit of information on the listening habits of the user, however it lacks some graphs showing the amount of scrobbles over time. I know there’s a handful of websites out there that have all kinds of graphs and can show you detailed information on most every aspect of your Last.fm library. However, I wanted to implement my own graph generator, one that didn’t have minutes of queue waiting.

At the moment my generator has two options, one where you can see your scrobbles over the course of weeks, months or even years and, if you want, compare it with another user. The other feature I added just recently, the Artist Scrobble History, shows you how many tracks by a particular artist you’ve scrobbled over time, again, you can also compare data between two users.

Because Last.fm’s API probably uses flood control and limits the requests, pulling data from their servers can take up some time, especially if it’s a lot of data (e.g. request a year’s worth) so I added database caching which speeds up the process a lot if you want to review earlier requested information. Currently the form will also auto complete artist names, granted, its implementation is not exactly great as it just pulls already cached names from the cache database rather than from Last.fm’s one. I could use the API’s artist search function but then I’d be stuck with the slow requests again.

Next up is AJAXification of the page, rather than page reloads I’d like the data to be pulled in with AJAX, if it takes a while a loading icon can be displayed and once all the information is downloaded the chart can be presented. All this will force me to refactor a whole lot of the code though. Rather than having a couple of functions and some procedural function calls which in the end result in the javascript getting the appropriate data I’ll need to make it so the arrays of data are returned with JSON encoding whenever the page is requested, that way the data can be handed to the ‘main’ page’s javascript which in turn can generate the graph.

I first tried the lazy way, copying all the generation code into a separate file and have AJAX pull that in, however since the JS wasn’t executed the chart wasn’t drawn and you didn’t see anything. So I had to use the eval() function for it to work. I’ve read that’s not really a great idea so even though it works this way, I’ll make a better, less hack-y version sometime.

In the future I might add another feature that plots how your genre listening habits have changed. If you have any other ideas feel free to post them in the comments and I’ll see if they can be added as well.
Jun 05

Home Automation System – An engineering project (EE5)

Just as I did with our previous projects I’m going to elaborate on the ‘Engineering Experience’ project we’ve done this semester. We opted to build a home automation (Domotica) system from scratch. We, a team of 4 (clicky & clicky) electronics students at Group T University College, spent the last five months or so developing and building a system that, in theory, could be used to control and sense stuff in your house. Here’s some explanation on both hardware/electronics and software.

Hardware

The essential hardware (excluding sensors such as temperature sensors, light sensors, switches, …):

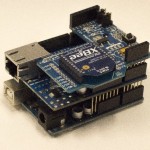
We made a ‘sandwich’ of the Uno, Ethernet and XBee shields which acts as the core, the central coordinator or access point. From here all data is received from and sent to modules around the house. Thanks to the Ethernet connection, a MySQL database is hooked up and a webinterface is able to check and control the entire system. Unfortunately the Uno only has one serial IO channel, which caused some problems in the end due to both shields being connected to that one line. We fixed most of them by software filtering but looking back it would’ve been easier if we had for example an Arduino Mega, which has 3 serial channels.

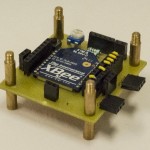
Module End Device

Module End Device

Arduino Uno - Ethernet Shield - XBee Shield stack

Uno, Ethernet & XBee Shield 

As you can see on the left, the end device “module” is something we designed ourselves. An XBee is used to send over sampling data to the Access Point and to receive commands (set a digital pin to logical 1 or 0).

You can easily attach sensors to any of the 8 available XBee pins (which can be set either to DIO or ADC).

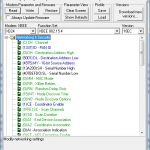
The programming of the XBee devices is done with a tool developed by Digi called X-CTU. We started out with a serial terminal to program the XBees but quickly switched to a more user-friendly application.

X-CTU

X-CTU

This program can be used to quickly change some parameters in the XBee’s firmware. The firmware can also be easily upgraded, which is a great thing since Digi seems to release a newer version every couple of months that introduces more features for the device.

Software

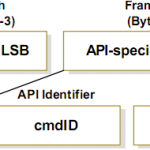
XBees can either be used in transparent or API mode. For more complex actions one quickly leaves the simple transparent mode behind and uses the somewhat more complex API mode. This mode uses packets (frames) of data to send over information.

XBee API packet

XBee API packet

XBeeP

XBeeP

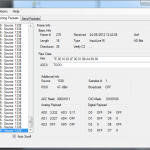
This was quite the challenge to be able to read the data, making sense of it and being able to use it to interpret voltages and status information. That’s why I developed a simple packet parser program in C# that quickly transforms any received data packet into human readable form. And so XBeeP was born!

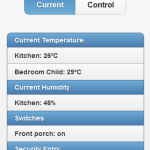
We transfer data to and from the database by  letting the Arduino do PHP GET requests. Packet data is assembled and parsed on the webserver which translates it into usable information that can be shown on an interface. For ease of use we developed both a regular website and a mobile version with jQuery mobile.

Mobile Interface

Mobile Interface

Regular interface

Regular interface

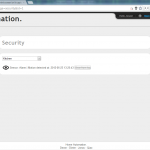
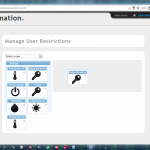
User Restrictions

User Restrictions

With these bits of software, the possibilities are nearly endless, you can create cron jobs or do a check every time the Arduino fetches a page to automate things like turning on the lights when it gets dark. We’ve added a scheduler where you can set actions to be performed at a certain time. These can also be set to be repeated daily or weekly.

Some other features the webinterface has:

  • User rights management (see screenshot above)
  • Easy overview of your switches and the option to turn them on or off
  • Temperature/humidity graph
  • Motion Detection notifications

Conclusion

This was always just a proof of concept project but it turned out to be pretty usable. Of course, for a commercial project a lot more security would be added as well as the usage of “confirmation” packets a module would send to the access point to notify it has correctly received a command. Some more checksum calculations should be added as well to make sure there is no corruption of information along the way.

To conclude, if you look at Twine, which is somewhat similar I think this project is a beautiful example of home automation systems that allow a lot more interactivity between the system and its users. A funfact here is that if our project would be an actual commercial product on the market it would be cheaper than a Twine with something like $30 to $50 per module and $100-150 for the central access point.

Update: more photos of the finished product can be found at http://ee5.crombeen.be/

Jun 03

Auto-Refresh Windows Sidebar Gadget Example

It’s silly how trivial a thing like grabbing a webpage’s content every minute and displaying it in a Sidebar gadget is. Granted, my knowledge of JavaScript and the like is limited to some basic functions (and mostly Google searches) but still..

What I wanted to do is have a sidebar gadget that grabs a page’s content every minute and displays it. First I tried with regular JavaScript without any luck. I moved on to the more familiar jQuery library and got it to work after a while. The main problem was the IE engine of the Sidebar caching the pages. To bypass this I just pass along the Unix timestamp in the URL.

So.. after messing around for a while, especially since it worked after 1 minute in a regular webbrowser and having barely to none capabilities to debug a sidebar gadget, here’s the working code:

<html>
<head>
	<title>SVO Status</title>
	<style>
		body{width:128;height:15}
    body{font-family:"Verdana", sans-serif;}
    body{font-size:11px;}
    body{margin:5px 2px 2px 2px;}
    body {background-color:#b0c4de;}
 
	</style>
<script language="javascript" src="jquery.js"></script>  
<script type="text/javascript">
jQuery.support.cors = true;
 
var refreshId = setInterval( function()
    {
      var seconds = new Date().getTime();       
      var url = "http://svo.skyon.be/s.php?cache=" + seconds;
      $.get(url, function(data) {
      $("#result").html(data);
       });
    }, 60000);
</script>  
 
 
  </head>
<body>
<div id="result"></div>
</body>
</html>

This excludes the gadget.xml file, which of course has to be added as well as the jQuery library.

I didn’t find any ready-made result out there so hopefully this post can help anyone who would like to make a simple status-fetching gadget.